
How to run rocks on your server
Note:
This documentation has moved to a new home! Please update your bookmarks to the new URL for the up-to-date version of this page.
Deploying rocks with Docker
As with any other OCI-compliant container image, rocks can be deployed with your favourite container management tool. This section depicts a typical deployment workflow for a generic Grafana rock, using Docker.
First, install Docker if it’s not already installed:
$ sudo apt-get install -y docker.io docker-compose-v2
We can deploy a container with the docker run command. This command has a number of possible parameters. The “Usage” section of the Grafana rock’s documentation has a table with an overview of parameters specific to the image.
$ sudo docker run -d --name grafana-container -e TZ=UTC -p 3000:3000 ubuntu/grafana:10.3.3-22.04_stable
Unable to find image 'ubuntu/grafana:10.3.3-22.04_stable' locally
10.3.3-22.04_stable: Pulling from ubuntu/grafana
bccd10f490ab: Already exists
549078d9d057: Pull complete
6ef870aa8500: Pull complete
2b475da7ccbd: Pull complete
Digest: sha256:df566ef90ecb14267a459081949ee7b6693fa573b97a7134a9a6722207275caa
Status: Downloaded newer image for ubuntu/grafana:10.3.3-22.04_stable
356e623ef2c16bc7d810bddccad8d7980f9c633aefc3a88bc8761eac4e1b1c50
In this particular case, we’re using:
-dto run the container in the background.- We are also specifying a well-defined name for the container, with the
--nameparameter. - With
-ewe are setting the container’s timezone (TZ) environment variable toUTC. - We also use
-pto map port 3000 of the container to 3000 on localhost. - The last parameter indicates the name of the rock, as listed in Docker Hub. Notice that the image tag we requested has the
_stablesuffix to indicate the image’s risk. This is called a Channel Tag and it follows a similar convention to snap “channels”.
This container, named grafana-container, serves Grafana 10.3.3 in an Ubuntu 22.04 LTS environment and can be accessed via local port 3000. Load the website up in your local web browser:
If you don’t have Firefox handy, curl can be used instead:
$ curl -s http://localhost:3000/login | grep "<title>"
    <title>Grafana</title>
Now that we’ve tested the deployment of the Grafana rock as a single container, let’s clean it up:
$ sudo docker ps
CONTAINER ID   IMAGE                                COMMAND                  CREATED          STATUS          PORTS                                       NAMES
356e623ef2c1   ubuntu/grafana:10.3.3-22.04_stable   "/bin/pebble enter -…"   17 minutes ago   Up 17 minutes   0.0.0.0:3000->3000/tcp, :::3000->3000/tcp   grafana-container
We can stop and remove the container as follows:
$ sudo docker stop grafana-container
$ sudo docker rm grafana-container
The Grafana rock’s documentation will also show you how to use Docker’s -v bind mounts to configure Grafana’s provisioning directory and data persistence.
Multi-container deployment
The section above explained the use of a single container for running a single software instance, but one of the benefits of using rocks is the ability to easily create and architecturally organise (or “orchestrate”) them to operate together in a modular fashion.
This section will demonstrate use of docker-compose to set up two container services that inter-operate to implement a trivial observability stack with the Prometheus and Grafana rocks.
Start by creating a Prometheus configuration file called prometheus.yml with the following contents:
global:
  scrape_interval: 1m

scrape_configs:
  - job_name: 'prometheus'
    scrape_interval: 1m
    static_configs:
      - targets: ['localhost:9090']
Note that this is a very simplistic example, where Prometheus only collects metrics about itself. You could expand the above configuration to tell Prometheus to scrape metrics from other sources.
Then, create the Compose file docker-compose.yml and define both services:
services:
  grafana:
    image: ubuntu/grafana:10.3.3-22.04_stable
    container_name: grafana-container
    environment:
      TZ: UTC
    ports:
      - "3000:3000"
  prometheus:
    image: ubuntu/prometheus:2.49.1-22.04_stable
    container_name: prometheus-container
    environment:
      TZ: UTC
    ports:
      - "9090:9090"
    volumes:
      - ./prometheus.yml:/etc/prometheus/prometheus.yml
Note that the Prometheus configuration file is being given to the container via a Docker volume (of type “bind mount”). The above sample could also be improved to also use another volume for persisting data, and even a Grafana default configuration for the Prometheus datasource.
Since we already installed Docker in the section above, all that is needed is to create and start the containers defined in this Compose file. This can be achieved with:
$ sudo docker compose up -d
[+] Running 10/10
 ✔ grafana Pulled
   ✔ bccd10f490ab Already exists
   ✔ 549078d9d057 Pull complete
   ✔ 6ef870aa8500 Pull complete
   ✔ 2b475da7ccbd Pull complete
 ✔ prometheus Pulled
   ✔ a8b1c5f80c2d Already exists
   ✔ f021062473aa Pull complete
   ✔ 9c6122d12d1d Pull complete
   ✔ 274b56f68abe Pull complete
[+] Running 3/3
 ✔ Network compose_default         Created
 ✔ Container prometheus-container  Started
 ✔ Container grafana-container     Started
As before, the -d indicates that all containers in this stack should be started in the background. You can confirm they are live and running with:
$ sudo docker compose ps
NAME                   IMAGE                                   COMMAND                  SERVICE      CREATED         STATUS         PORTS
grafana-container      ubuntu/grafana:10.3.3-22.04_stable      "/bin/pebble enter -…"   grafana      3 seconds ago   Up 3 seconds   0.0.0.0:3000->3000/tcp, :::3000->3000/tcp
prometheus-container   ubuntu/prometheus:2.49.1-22.04_stable   "/bin/pebble enter -…"   prometheus   3 seconds ago   Up 3 seconds   0.0.0.0:9090->9090/tcp, :::9090->9090/tcp
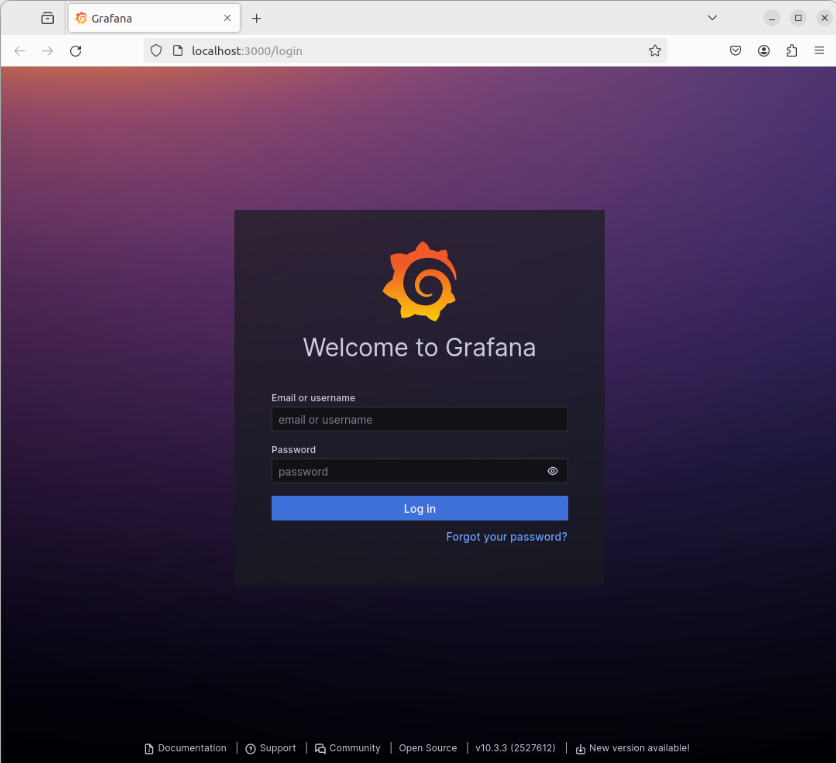
Opening http://localhost:3000 will give you the same Grafana login page as before:
Use the default username admin and password admin to login:
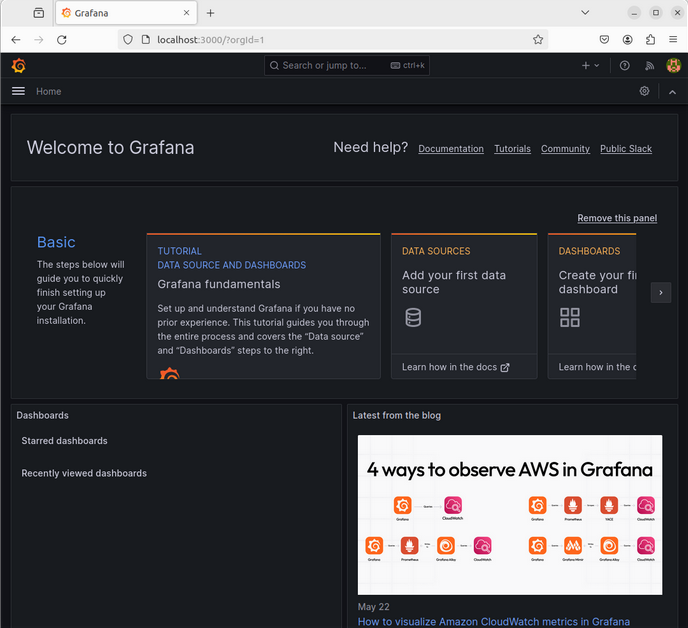
By clicking on “Data Sources” you can then add Prometheus and provide the server URL http://prometheus:9090:
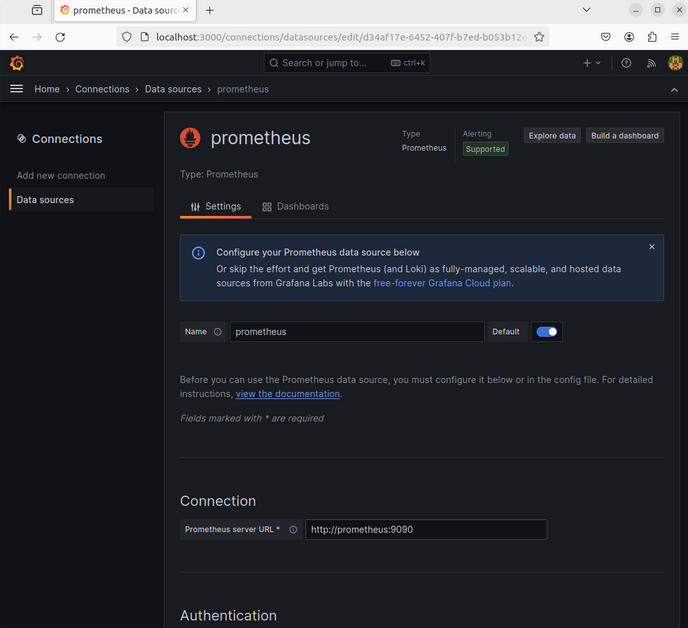
This URL works because Docker Compose ensures both containers are on the same Docker network and that they can be discovered via their service name.
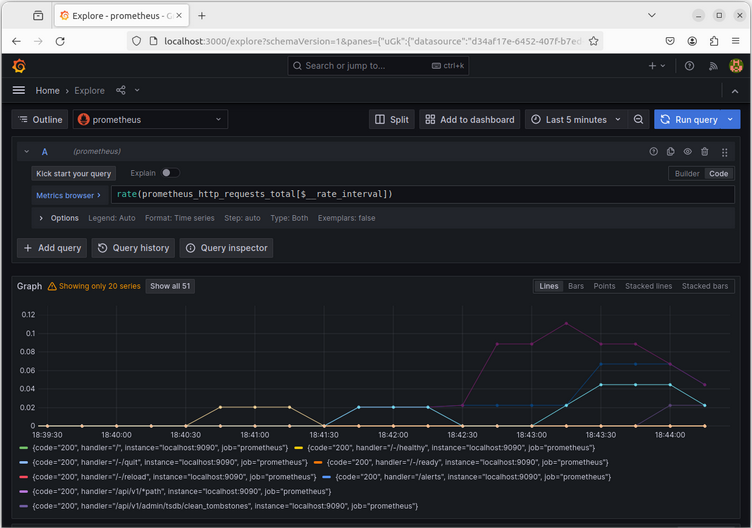
Finally, click on “Explore” from the Grafana menu, and select the prometheus datasource. You can now query and visualise the Prometheus metrics. For example:
Next Steps
As you can see, docker-compose makes it convenient to set up multi-container applications without needing to perform runtime changes to the containers. As you can imagine, this can permit building a more sophisticated management system to handle fail-over, load-balancing, scaling, upgrading old nodes, and monitoring status. But rather than needing to implement all of this directly on top of docker-container, you may want to investigate Kubernetes-style cluster management software such as microk8s.