
ML Observability: what, why, how

Andreea Munteanu
on 6 July 2023
Tags: AI/ML , AIML , LMA , MLOps , observability
Note: This post is co-authored by Simon Aronsson, Senior Engineering Manager for Canonical Observability Stack.
AI/ML is moving beyond the experimentation phase. This involves a shift in the way of operating because productising AI involves many sophisticated processes. Machine learning operations (MLOps) is a new practice that ensures ML workflow automation in a scalable and efficient manner. But how do you make MLOps observable? How can you better understand how your product-grade AI initiative and its infrastructure are performing?
This is where observability comes in. With open source solutions, having observable MLOps is no longer just a nice-to-have, but a business-critical feature. In this post, we will explore this topic together, focusing on how open source helps us level up the reliability, quality and value of our MLOps platform.
An overview of observability
What is observability?
Observability is a measure of how well the behaviour and state of a system can be reasoned about – using only its external outputs. In general, it describes the ability of a system to generate telemetry signals that communicate its internal state to any observer.
Observability vs monitoring
In an earlier article, we explored how people viewed observability and monitoring and how the two terms compare to each other. But it turns out, not everyone may agree on the differences here. The outcome of two polls we posted on Twitter (left) and LinkedIn (right) is both hilarious and telling. In sum, the difference may not be as clear-cut.

The practice of “observability” itself isn’t all that new. Developers and system administrators have been doing this for years, though under the somewhat less trendy term monitoring. They do still, however, both hold significant value when it comes to explaining the practice.
While observability measures how well we are able to reason about the system based on the telemetry it exposes, as explained in the previous section, monitoring describes the act of continuously fetching and evaluating the data said system is exposing.
Rather than being different practices, or just pointless marketing terms, both serve a purpose in describing the practice of remaining on top of how our systems are doing. For the sake of this post, we’ll refer to both practices using the term observability.
MLOps Observability
MLOps is essentially DevOps for machine learning. It unifies development and operations. In order to reach effectiveness, it combines continuous training (CT), continuous integration (CI) and continuous delivery (CD).
Observability combines metrics, logs, events and traces to help us detect, investigate and resolve issues, failures or unexpected behaviour. The goal goes beyond seeing why a system has failed, but rather understanding the current state of it and how that state was reached.
In the context of MLOps, the system refers to all the tools that enable machine-learning engineers and data scientists to perform their job, including Kubeflow, MLFlow, Jupyter Notebooks, or Seldon Core.
When it comes to observability for MLOps, there are a couple of specific aspects that need to be taken into account:
- Machine learning models need continuous development.
- Data is often messy: missing values, inconsistent data inputs or duplicates are common.
- Any change in the data schema can have a tremendous impact on the model’s accuracy.
- Machine learning models should, to as high an extent as possible, be protected from bias.
Thus, solutions that are designed for observing MLOps tools should not only alert when systems have problems, but also when machine learning models are failing or data is drifting. The system should do telemetry collection, which includes events, logs, metrics and traces, through the entire machine learning lifecycle. Furthermore, it should deliver actionable insights. Ideally, it monitors the infrastructure, as well as the data distribution throughout all the stages.
Like other observable tools, MLOps tooling should benefit from a set of alerts that inform the teams about any failure of the system, as well as visualisations that enable teams to dig deeper into details and analyse any changes.
Why does observability help?
Observability is a key factor that helps teams continuously improve their models and be aware of the costs associated with them. Its first goal is to surface problems accurately and in a timely way. Not only do the problems need to be surfaced quickly, but it’s equally important that the problems surface are actually there, and not just false positives. This prevents end-users from feeling frustrated but also reduces the unnecessary costs associated with systems being unavailable.
Going a step further, observability also impacts the resolution time of a problem. It enables teams to quickly get to the root cause. In the case of machine learning systems, observability guides professionals within the lifecycle, where the problem appeared, regardless of the nature of it – be it input data distribution, feature transformation, or model prediction.
Providing all of this through proactive alerting, using carefully crafted alerting conditions (alert rules), saves users time by allowing them to run their models without actively supervising the jobs, other than in the case of issues.
By having a good observability functionality, machine learning model owners can quickly find, not only the root cause of a problem but also see all the impacted steps within the lifecycle.
Data drift: can observability help?
Machine learning models are developed using historical data, so over time they can become outdated due to changes to the data. This phenomenon is called drift and refers to properties changing the dataset used for model training. It usually affects the model performance and results in a decline in the model’s ability to make accurate predictions.
Data drift is one of the drift types. It occurs when the distribution of the input data changes over time. It includes unexpected modifications to the data structure, resulting in a new data architecture. It corrupts the processes and affects the model’s ability to predict.
Observability helps detect data drift, and prevents the risks of its effect. In order to achieve that, both models and datasets should be continuously monitored and evaluated. Using models that are robust enough to prevent drift is one of the key factors to ensure success with production-grade AI/ML projects.
In order to detect the drift, developers can use a model-centric approach, where any drift of the input data is detected, or statistical tests. These tests are split into three main categories:
- Sequential analysis methods
- Accustomed model to detect drift
- Time distribution method
The last option is the most common; it uses statistics to compute the difference between two probability distributions to detect drift.
An open-source approach
Many of the most commonly used tools for observability out there are already available as open source, with Grafana and Prometheus being noteworthy examples. These tools have been used and trusted by site reliability and operations engineers for serious usage in mission-critical production environments for many years.
Extending the use case for these tools to also monitor and observe our machine-learning stack, as well as the models contained within it, is a natural extension of their applicability.
Getting these tools up and running, properly configured and integrated both with each other and with the MLOps solution they are supposed to monitor and observe could easily end up in a huge time investment. The Canonical Observability Stack is fully open source and runs on top of Kubernetes. It combines all the best open source observability tools, like Prometheus, Loki, Alertmanager, and Grafana, into a turn-key, low-maintenance observability stack ready for serious production usage.
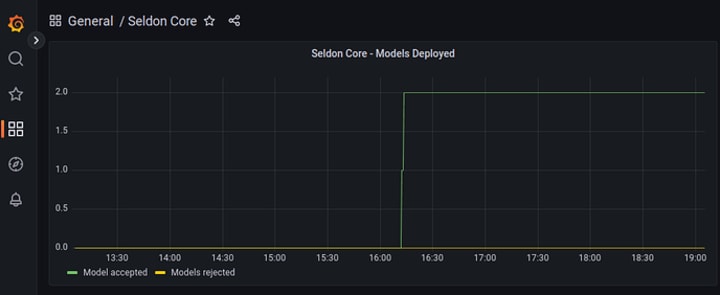
The stack can be easily deployed and integrated with MLOps tool such as Charmed Kubeflow. It enables users to get access to telemetry describing the health and state of the MLOps platform. It also enables professionals to build bespoke Grafana dashboards for deeper analysis.
Want to know more, discuss, or contribute to the future of ML Observability, come join the thriving community on Charmhub!
Would you like to learn more about AI/ML and open source?
Contact us nowEnterprise AI, simplified

AI doesn’t have to be difficult. Accelerate innovation with an end-to-end stack that delivers all the open source tooling you need for the entire AI/ML lifecycle.
Newsletter signup
Related posts
Let’s meet at AI4 and talk about AI infrastructure with open source
Date: 11 – 13 August 2025 Booth: 353 Book a meeting You know the old saying: what happens in Vegas… transforms your AI journey with trusted open source. On...
Beyond tokens per watt – using Ubuntu 26.04 LTS for AI
Tokens per watt (TpW) – the measure of useful AI work produced per watt of energy consumed – is the metric at top of mind for CEOs, heads of AI, and...
Securing AI agent workflows on Ubuntu with the new NVIDIA OpenShell snap
By packaging OpenShell as a snap, Canonical is enabling enterprises to confidently run next-generation agentic workflows across local devices, hybrid...