Monitoring “big software” stacks with the Elastic Stack
Charles Butler
on 22 September 2016
Tags: elastic , Juju , planetubuntu
Big Software is a new class of application. It’s composed of so many moving pieces that humans, by themselves, cannot design, deploy or operate them. OpenStack, Hadoop and container-based architectures are all examples of Big Software.
- Gathering service metrics for complex big software stacks can be a chore
- Especially when you need to warehouse, visualize, and share the metrics
- It’s not just about measuring machine performance, but application performance as well
You usually need to warehouse months of history of these metrics so you can spot trends. This enables you to make educated infrastructure decisions. That’s a powerful tool that’s usually offered on the provider level. But what if you run a hybrid cloud deployment? Not every cloud service is created equally.
The Elastic folks provide everything we need to make this possible.
Additionally we can connect it to all sorts of other bundles in the charm.
Stack
Big Software is a new class of application. It’s composed of so many moving pieces that humans, by themselves, cannot design, deploy or operate them. OpenStack, Hadoop and container-based architectures are all examples of Big Software.
Gathering service metrics for complex big software stacks can be a chore. Especially when you need to warehouse, visualize, and share the metrics. It’s not just about measuring machine performance, but application performance as well.
You usually need to warehouse months of history of these metrics so you can spot trends. This enables you to make educated infrastructure decisions. That’s a powerful tool that’s usually offered on the provider level. But what if you run a hybrid cloud deployment? Not every cloud service is created equally.
The Elastic folks provide everything we need to make this possible. Additionally we can connect it to all sorts of other bundles in the charm store. We can now collect data on any cluster, store it, and visualize it. Let’s look at the pieces that are modeled in this bundle:
- Elasticsearch – a distributed RESTful search engine
- Beats – lightweight processes that gather metrics on nodes and ship them to Elasticsearch.
- Filebeat ships logs
- Topbeat ships “top-like” data
- Packetbeat provides network protocol monitoring
- Dockerbeat is a community beat that provides app container monitoring
- Logstash – Performs data transformations, and routing to storage. As an example: Elasticsearch for instant visualization or HDFS for long term storage and analytics
- Kibana – a web front end to visualize and analyze the gathered metrics
Getting Started
First, install and configure Juju. This will allow us to model our clusters easily and repeatedly. We used LXD as a backend in order to maximize our ability to explore the cluster on our desktops/laptops. Though you can easily deploy these onto any major public cloud.
juju deploy ~containers/bundle/beats-coreThis will give you a complete stack, it looks like this:
Note: if you wish to deploy the latest version of this bundle, the ~containers team is publishing a development channel release as new beats are added to the core bundle.
juju deploy ~containers/bundle/beats-core --channel=developmentOnce everything is deployed we need to deploy the dashboards:
juju action do kibana/0 deploy-dashboard dashboard=beatsNow do a `juju status kibana` to get the ip address to the unit it’s allocated. Now we are… monitoring nothing. We need something to connect it to, and then introduce it to beats, so something like:
juju deploy myapplication
   juju add-relation filebeat:beats-host myapplication
   juju add-relation topbeat:beats-host myapplication
Let’s connect it to something interesting, like an Apache Spark deployment.
Integrating with other bundles
The standalone bundle is useful but let’s use a more practical example. The Juju Ecosystem team has added elastic stack monitoring to a bunch of existing bundles. You don’t even have to manually connect the beats-core deployment to anything, you can just use an all in one bundle:
To deploy this bundle in the command line:
juju deploy apache-processing-sparkWe also recommend running `juju status` periodically to check the progress of the deployment. You can also just open up a new terminal and keep `watch juju status` in a window so you can have the status continuously display while you continue on.
In this bundle: Filebeat and Topbeat act as subordinate charms. Which means they are co-located on the spark units. This allows us to use these beats to track each spark node. And since we’re adding this relationship at the service level; any subsequent spark nodes you add will automatically include the beats monitors. The horizontal scaling of our cluster is now observable.
Let’s get the kibana dashboard ready:
juju set-config kibana dashboards="beats"Notice that this time, we used charm config instead of an action to deploy the dashboard. This allows us to blanket configure, and deploy the kibana dashboards from a bundle. Reducing the number of steps a user must take to get started.
After deployment you will need to do a `juju status kibana` to get the IP address of the unit. Then browse to it in your web browser. For those of you deploying on public clouds: you will need to also do `juju expose kibana` to open a port in the firewall to allow access. Remember, to make things accessible to others in our clouds Juju expects you to explicitly tell it to do this. Out-of-the-box we keep things closed.
When you get to the kibana GUI you need add `topbeat-*` or `filebeat-*` in the initial screen setup to set up Kibana’s index. Make sure you click the “Create” button for each one:
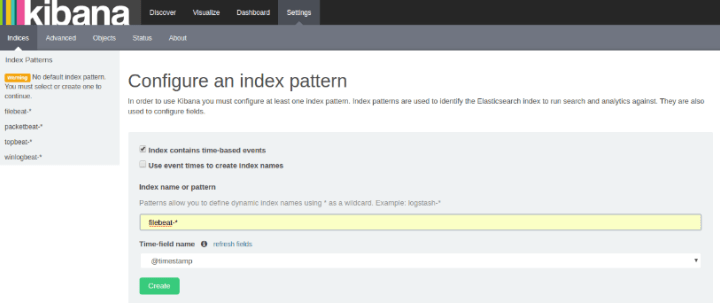
Now we need to load the dashboard’s we’ve included for you, click on the “Dashboard” section and click the load icon, then select the “topbeat-dashboard”:
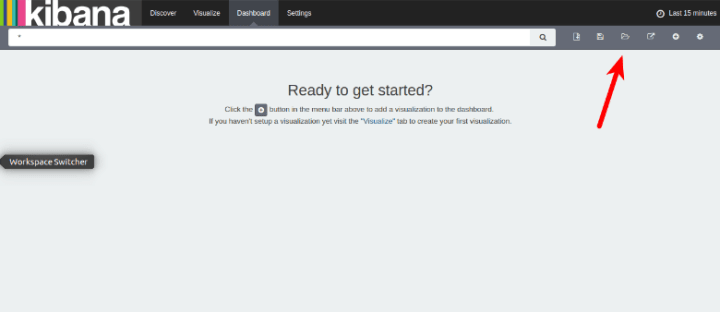

Now you should see a your shiny new dashboard:
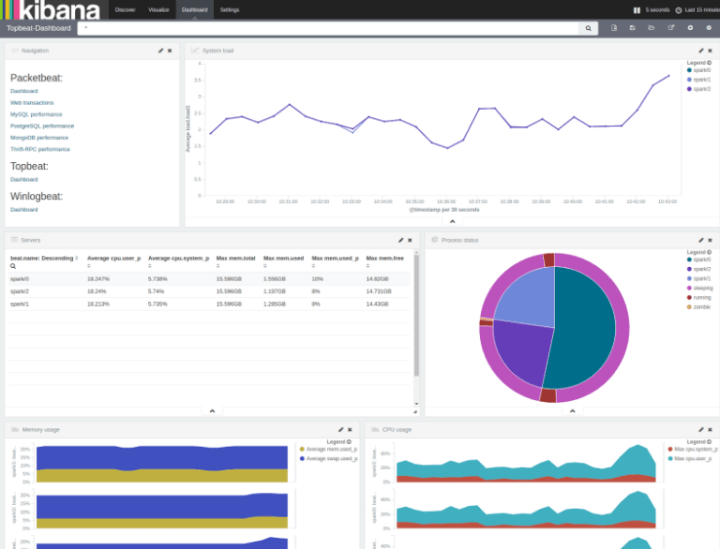
You now have an observable Spark cluster! Now that your graphs are up, let’s run something to ensure all the working pieces are working, let’s do a quick pagerank benchmark:
juju run-action spark/0 pagerankThis will output a UUID for your job for you to query for results:
juju show-action-output You can find more about available actions in the bundle’s documentation. Feel free to launch the action multiple times if you want to exercise the hardware, or run your own Spark jobs as you see fit.
By default the `apache-processing-spark` bundle gives us three nodes. I left those running for a while and then decided to grow the cluster. Let’s add 10 nodes
juju add-unit -n10 sparkYour `juju status` should be lighting up now with the new units being fired up, and in Kibana itself we can see the rest of the cluster coming online in near-realtime:
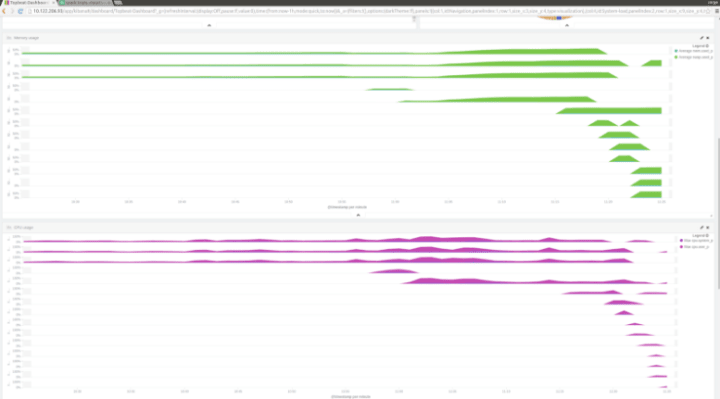
Here you can see the CPU and memory consumption of the cluster. You can see the initial three nodes hanging around, and then as the other nodes come up, beats gets installed and they report in, automatically.
Why automatically? ‘apache-processing-spark’ technically is just some yaml. The magic is that we are not just deploying code, we’re modelling the relationship between these applications:
relations:
  - [spark, zookeeper]
  - ["kibana:rest", "elasticsearch:client"]
  - ["filebeat:elasticsearch", "elasticsearch:client"]
  - ["filebeat:beats-host", "spark:juju-info"]
  - ["topbeat:elasticsearch", "elasticsearch:client"]
  - ["topbeat:beats-host", "spark:juju-info"]
So when spark is added, you’re not just adding a new machine, you’re mutating the scale of the application within the model. But what does that mean?
A good way to think about it is just like simple elements and compounds. For example: Carbon Monoxide (CO) and Carbon Dioxide (CO2) are built from the exact same elements. But the combination of those elements allow for two different compounds with different characteristics. If you think of your infrastructure similarly, you’re not just designing the components that compose it. But the number of interactions that those components have with themselves and others.
So, automatically deploying filebeat and topbeat when spark is scaled just becomes an automatic part of the lifecycle. In this case, one new spark unit results in one new unit of filebeat, and one new unit of topbeat. Similarly, we can change this model as our requirements change.
This post-deployment mutability of infrastructure is one of Juju’s key unique features. You’re not just defining how applications talk and relate to each other. You’re also defining the ratios of units to their supporting applications like metrics collection.
We’ve given you two basic elements of beats today, filebeat, and topbeat. And like chemistry, more elements make for more interesting things. So now let’s show you how to expand your metrics-gathering to another level.
Charming up your own custom beat
Elastic has engineered Beats to be expandable. They have invested effort in making it easy for you to write your own “beat”. As you can imagine, this can lead to an explosion of community-generated beats for measuring all sorts of things. We wanted to enable any enthusiast of the beats community to be able to hook into a Juju deployed workload.
As part of this work we’ve published a beats base layer. This will allow you to generate a charm for your custom beat. Or any of the community written beats for that matter. Then deploy it right into your model, just like we do with topbeat and filebeat. Let’s look at an example:
The Beats-base layer
Beats Base provides some helper python code to handle the common patterns every beats unit will undergo. Such as declaring to the model how it will talk to Logstash and/or Elasticsearch. This is always handled the same way among all the beats. So we’re keeping developers from needing to repeat themselves.
Additionally the elasticbeats library handles:
- Unit index creation
- Template rendering in any context
- Enabling the beat as a system service
So starting from beats-base, we have 3 concerns to address and we will have delivered our beat:
- How to install your beat (delivery)
- How to configure your beat (template config)
- Declare your beats index (payload delivery from installation step)
Let’s start with Packetbeat as an example. Packetbeat is an open source project that is designed to provide real‑time analytics for web, database, and other network protocols.
charm create packetbeatEvery charm starts with a layer.yaml
includes:
- beats-base
- apt
- repository: http://github.com/juju-solutions/layer-packetbeat
Let’s add a little bit of metadata.yaml
name: packetbeat
summary: Deploys packetbeat
maintainer: Charles Butler
description: |
  data shipper that integrates with Elasticsearch to provide
  real-time analytics for web, database, and other
  network protocols
series:
  - trusty
Tags:
monitoring
analytics
networking
With those meta files in place we’re ready to write our reactive code.
reactive/packetbeat.pyFor delivery of packetbeat, elastic has provided a deb repository for the official beats. This makes delivery a bit simpler using the apt-layer. The consuming code is very simple:
import charms.apt

@when_not('apt.installed.packetbeat')
def install_filebeat():
    status_set('maintenance', 'Installing packetbeat')
    charms.apt.queue_install(['packetbeat'])
This completes our need to deliver the application. The apt-layer will handle all the usual software delivery things for us like installing and configuring an apt repository, etc. Since this layer is reused in charms all across the community, we merely reuse it here.
The next step is modeling how we react to our data-sources being connected. This typically requires rendering a yaml file to configure the beat, starting the beat daemon, and reacting to the beats-base beat.render state.
In order to do this we’ll be adding:
- Configuration options to our charm
- A Jinja template to render the yaml configuration
- Reactive code to handle the state change and events
The configuration for packetbeat comes in the form of declaring protocol and port. This makes attaching packetbeat to anything transmitting data on the wire simple to model with configuration. We’ll provide some sane defaults, and allow the admin to configure the device to listen on.
Config.yaml

  device:
    type: string
    default: any
    description: Device to listen on, eg eth0
  protocols:
    type: string
    description: |
      the ports on which Packetbeat can find each protocol. space
      separated protocol:port format.
    default: "http:80 http:8080 dns:53 mysql:3306 pgsql:5432   redis:6379 thrift:9090 mongodb:27017 memcached:11211"

templates/packetbeat.yml

# This file is controlled by Juju. Hand edits will not persist!
interfaces:
  device: {{ device }}
protocols:
  {% for protocol in protocols -%}
    {{ protocol }}:
      ports: {{ protocols[protocol] }}
  {% endfor %}
{% if elasticsearch -%}
output:
  elasticsearch:
    hosts: {{ elasticsearch }}
{% endif -%}
{% if principal_unit %}
shipper:
  name: {{ principal_unit }}
{% endif %}


reactive/packetbeat.py

from charms.reactive import set_state
from charmhelpers.core.host import service_restart
from charmhelpers.core.hookenv import status_set
from elasticbeats import render_without_context


@when('beat.render')
@when_any('elasticsearch.available', 'logstash.available')
def render_filebeat_template():
    render_without_context('packetbeat.yml', '/etc/packetbeat/packetbeat.yml')
    remove_state('beat.render')
    service_restart('packetbeat')
    status_set('active', 'Packetbeat ready')
With all these pieces of the charm plugged in, run a `charm build` in your layer directory and you’re ready to deploy the packetbeat charm.
juju deploy cs:bundles/beats-core
    juju deploy cs:trusty/consul
    juju deploy ./builds/packetbeat

    juju add-relation packetbeat elasticsearch
    juju add-relation packetbeat consul
Consul is a great test, we can attach a single beat and monitor DNS, and Web traffic thanks to its UI
juju set-config packetbeat protocols=”dns:53 http:8500”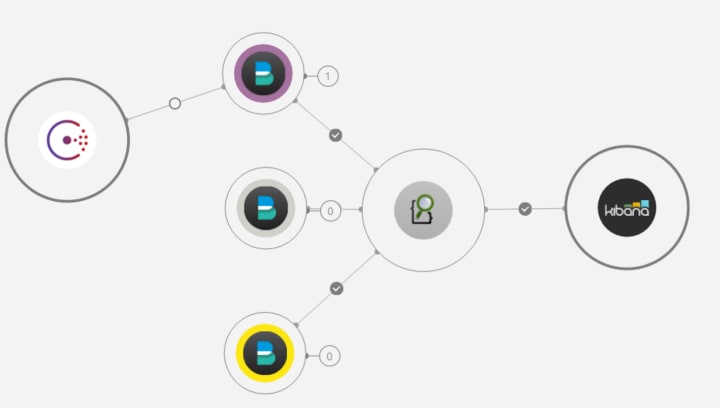
Load up the kibana dashboard, and look under the “Discover” tab. There will be a packetbeat index, and data aggregating underneath it. Units requesting cluster DNS will start to pile on as well.
To test both of these metrics, browse around the Consul UI on port 8500. Additionally you can ssh into a unit, and dig @ the consul dns server to see DNS metrics populate.
Populating the Packetbeat dashboard from here is a game of painting with data by the numbers.
Conclusion
Observability is a great feature to have in your deployments. Whether it’s a brand new 12-factor application or the simplest of MVC apps. Being able to see inside the box is always a good feature for modern infrastructure to own.
This is why we’re excited about the Elastic stack! We can plug this into just about anything and immediately start gathering data. We’re looking forward to seeing how people bring in new beats to connect other metrics to existing bundles.
We’ve included this bundle in our Swarm, Kubernetes and big data bundles out of the box. I encourage everyone who is publishing bundles in the charm store to consider plugging in this bundle for production-grade observability.
Talk to us today
Interested in running Ubuntu in your organisation?
Newsletter signup
Related posts
Deploy your Spring Boot application to production
In this article we walk through the steps required to deploy a Spring Boot application to production using Juju and Kubernetes. The goal is to showcase the...
Cut data center energy costs with bare metal automation
Data centers don’t have to be power-hungry monsters. With smart automation using tools like MAAS, you can reduce energy waste and operational costs, and make...
The hitchhiker’s guide to infrastructure modernization
One of my favourite authors, Douglas Adams, once said that “we are stuck with technology when what we really want is just stuff that works.” Whilst Adams is...
